Demo 2: Differentiability#
Demo by Christian Mikkelstrup, Hans Henrik Hermansen, Karl Johan Måstrup Kristensen and Magnus Troen
from sympy import *
from dtumathtools import *
init_printing()
When it comes to Python/CAS and differentiability, we face the same difficulties as with continuity. Python/CAS is not very suitable for proving differentiability. It can, however, be a powerful tool once differentiability is proven/assumed. In this demo we will show how CAS/python can be used when working with differentiable functions.
Vector Functions#
Vector functions of multiple variables are defined in Definition 1.3.1 and can be written as
We already know examples of vector functions of several variables from linear algebra, namely linear mappings from \(\mathbb R^n\) to \(\mathbb R^k\). Which for an arbitrary \(k \times n\) matrix \(A\) and a vector \(\boldsymbol{x} \in \mathbb R^n\) will have the form
Here, the functions \(f_1, f_2, \ldots, f_k\) are determined by the matrix-vector multiplication you know from Mat1a.
We now extend the concept to general vector functions of several variables, where the coordinate functions \(f_1, f_2, \ldots, f_k\) are not limited by the rules of matrix-vector multiplication, \(f_i(x_1,x_2,x_3) = c_1x_1 + c_2x_2 + c_3x_3\) . A coordinate function \(f_i\) could, for example, have the formula \(f_i(x_1,x_2,x_3) = x_1 \sin(x_2) + x_3^2\).
In Sympy, vector functions can be constructed using matrix objects or callable functions:
# Example of a vector function using the Matrix class
x1, x2, x3 = symbols('x1:4')

f_expr = Matrix([
    x1 * sin(x2) + x3**2,
    x1*x2*x3,
    x1**2 + 4*x2 * x3
])
f_expr
Which can be evaluated with .subs():
f_expr.subs({x1: 1, x2: 2, x3: 3})
If you prefer functions, the same can be achieved with
def f(x1, x2, x3):
    return Matrix([
        x1 * sin(x2) + x3**2,
        x1*x2*x3,
        x1**2 + 4 * x2 * x3
    ])

f(x1,x2,x3)
f(1,2,3)
Both approaches yield the same result. Which method you choose is up to personal preference.
Gradient Vector#
An example of a vector function is the gradient vector, as introduced last week:
This can be considered as the map \(\nabla f: \mathbb R^n \to \mathbb R^n\).
As an example we will consider the gradient of the function \(f: \mathbb{R}^2 \to \mathbb{R}\), defined by \(f(\boldsymbol{x}) = 1 - \frac{x_1^2}{2} -\frac{x_2^2}{2}\)
x1, x2 = symbols('x1:3')
f = 1 - x1**2 / 2 - x2**2 / 2

Nabla = dtutools.gradient(f)

f, Nabla
This gives us a vector function \(\nabla f: \mathbb R^2 \to \mathbb R^2\) defined by \(\nabla f(x_1, x_2) = (-x_1, -x_2)\). Which for example can be evaluated in \(\boldsymbol{x}_0 = (1, -1)\) which yields:
Nabla.subs({x1: 1, x2: -1})
Directional Derivatives#
Consider the same function \(f: \mathbb{R}^2 \to \mathbb{R}\) with the functional expression \(f(\boldsymbol{x}) = 1 - \frac{x_1^2}{2} -\frac{x_2^2}{2}\).
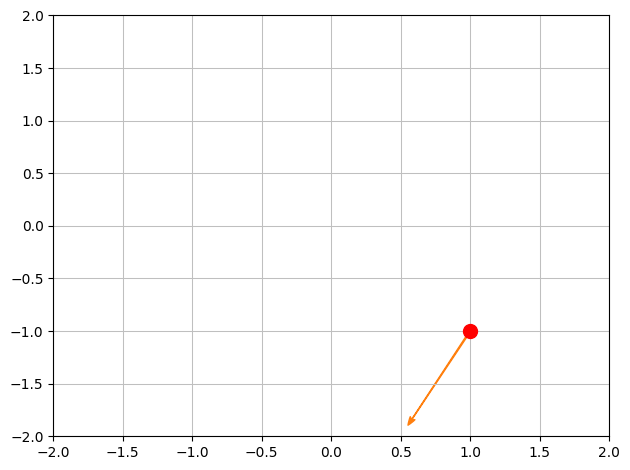
We wish to find the directional derivative of \(f\) at the point \(\boldsymbol{x_0} = (1,-1)\) in the direction of the unit vector \(\boldsymbol{e}\).
x0 = Matrix([1,-1])
e = Matrix([-1,-2]).normalized()
e, N(e)
p1 = dtuplot.scatter(x0, rendering_kw={"markersize":10,"color":'r'}, xlim=[-2,2],ylim=[-2,2],show=False)
p1.extend(dtuplot.quiver(x0,e,show=False))
p1.show()

We compute the gradient at \(\boldsymbol{x_0}\):
Nabla = Matrix([diff(f,x1),diff(f,x2)]).subs({x1:x0[0],x2:x0[1]})
Nabla
Now the directional derivative is given by \(\nabla_{\boldsymbol{e}} f(\boldsymbol{x_0}) = \braket{\boldsymbol{e},f(\boldsymbol{x_0})}\).
a = e.dot(Nabla)
a

The Hessian Matrix#
When we have to use a concept of the curvature of multivariate scalar functions (relevant later for extrema analysis and Taylor expansion), we have to start with second-order partial derivatives. The information about these second-order derivatives is collected in the Hessian matrix described in Definition 3.5.1.
It can be constructed manually in Sympy from a given function with its associated second-order partial derivative.
f = 1-x1**2/2-x2**3/2*x3 + x1*x3
f

fx1x1 = f.diff(x1,2)
fx1x2 = f.diff(x1,x2)
fx1x3 = f.diff(x1,x3)
fx2x2 = f.diff(x2,2)
fx2x3 = f.diff(x2,x3)
fx3x3 = f.diff(x3,2)

H1 = Matrix([
    [fx1x1, fx1x2, fx1x3],
    [fx1x2, fx2x2, fx2x3],
    [fx1x3, fx2x3, fx3x3]
])

H1
Which of course has an equivalent function implemented in dtumathtools:
H2 = dtutools.hessian(f)
H2
In both cases this can be evaluated with .subs():
H1.subs({x1:1,x2:2,x3:3}), H2.subs({x1:1,x2:2,x3:3})
The Jacobian Matrix#
Definition 3.8.1 allows us to also differentiate multivariate vector functions in the form of the Jacobian matrix. To illustrate this, we define the function \(\boldsymbol{f}: \mathbb{R}^4 \to \mathbb{R}^3\):
x1,x2,x3,x4 = symbols('x1:5', real = True)

f = Matrix([
    x1**2 + x2**2 * x3**2 + x4**2 - 1,
    x1 + x2**2/2 - x3 * x4,
    x1 * x3 + x2 * x4
])

f
Note that \(f_1, f_2, f_3\) are differentiable for all \(\boldsymbol{x} \in \mathbb R^4\), and we can compute the Jacobian matrix as
This can be done manually:
J_f = Matrix.vstack(dtutools.gradient(f[0]).T, dtutools.gradient(f[1]).T, dtutools.gradient(f[2]).T)
J_f
It can also be done using Sympy’s command jacobian:
J = f.jacobian([x1,x2,x3,x4])
J
Parametric Curves in the \((x,y)\) Plane and their Tangents#
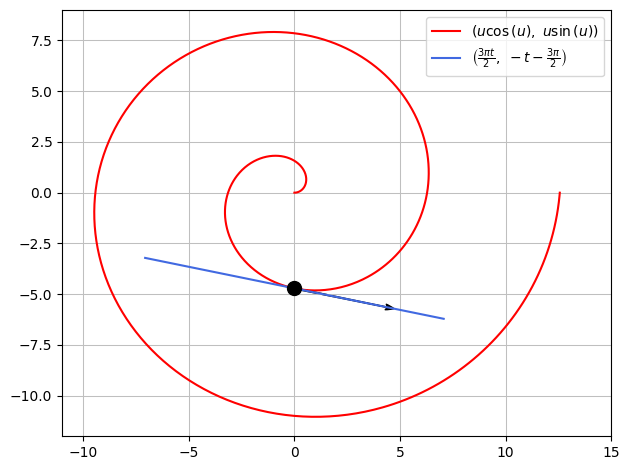
Consider a spiral with the following parametric representation:
u, t = symbols('u t', real=True)
r = Matrix([u*cos(u), u*sin(u)])
r
The tangent vector at a given point is given by
rd = diff(r,u)
rd
We will now find the parametric representation of the tangent to the spiral at \((0,-\frac{3\pi}{2})\), corresponding to the parametric value \(u_0 = \frac{3\pi}{2}\), which is seen by
u0 = 3*pi/2
rdu0 = rd.subs(u,u0)
ru0 = r.subs(u,u0)
ru0
The parametric representation for the tangent at \(u_0\) is found by
T = ru0 + t*rdu0
T
Which we can now visualize as
p = dtuplot.plot_parametric(r[0], r[1],(u,0,4*pi),rendering_kw={"color":"red"},use_cm=False,show=False)
p.extend(dtuplot.plot_parametric(T[0],T[1],(t,-1.5,1.5),rendering_kw={"color":"royalblue"},use_cm=False,show=False))
p.extend(dtuplot.scatter(ru0,rendering_kw={"markersize":10,"color":'black'}, show=False))
p.extend(dtuplot.quiver(ru0,rdu0,rendering_kw={"color":"black"},show=False))
p.xlim = [-11,15]
p.ylim = [-12,9]

p.show()


